| Sign Up For Our Newsletter |
| Sign Up For Our Newsletter |
Graphs Charts, and Diagrams - CCSS 2.MD.D.9, 2.MD.D.10
Links verified on 03/17/2025
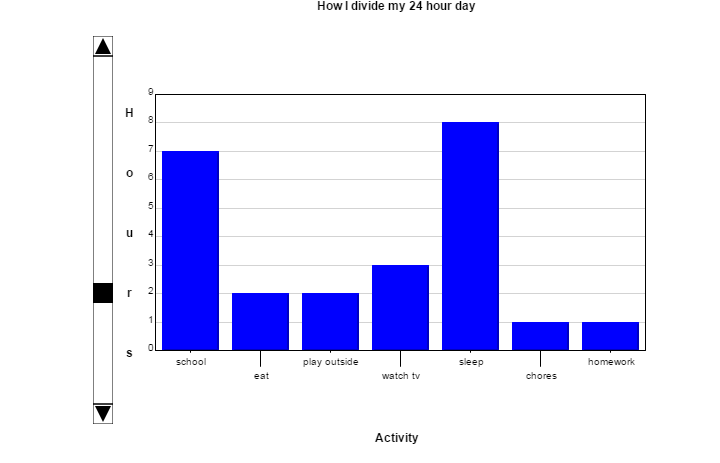
1. Bar Chart.
Click Image to Enlarge
Create your own bar graph using your data. SEE MORE
2. Bar Graph Interactive.
Click Image to Enlarge
Graph data sets in bar graphs using your own data or pre-set data. SEE MORE
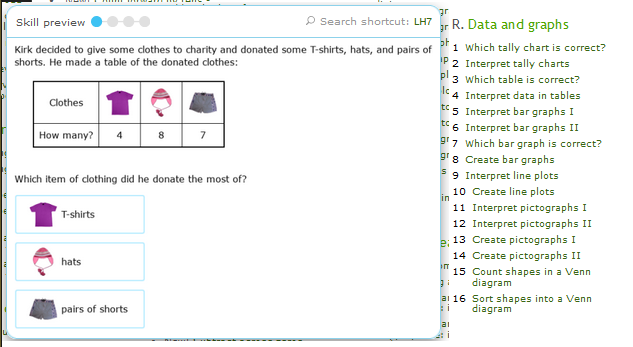
3. Data & Graphs.
Click Image to Enlarge
IXL offers sixteen second grade math skills to explore and learn! SEE MORE
4. Graph Quiz Generator.
Click Image to Enlarge
Make you own quizzes by selecting the number of questions, the level of difficulty, and the specific types of charts or graphs to include in the questions. SEE MORE
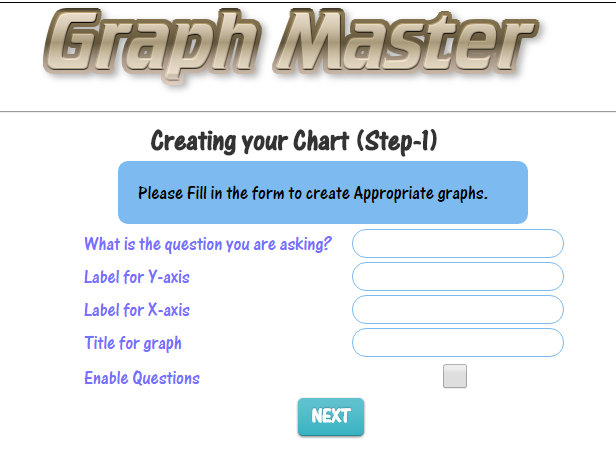
5. Graphmaster.
Click Image to Enlarge
Students can create their own interactive bar graph, line graph, or pie charts inputting their own data. Each graph will also generate questions about the graph. SEE MORE
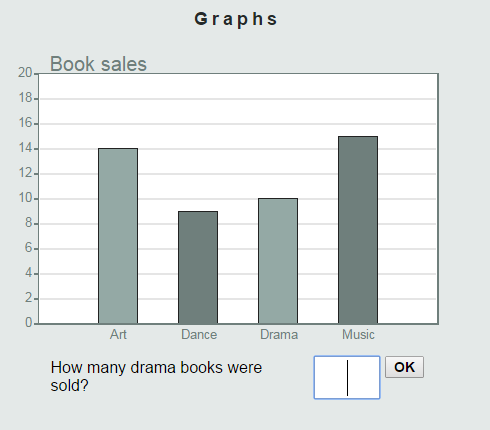
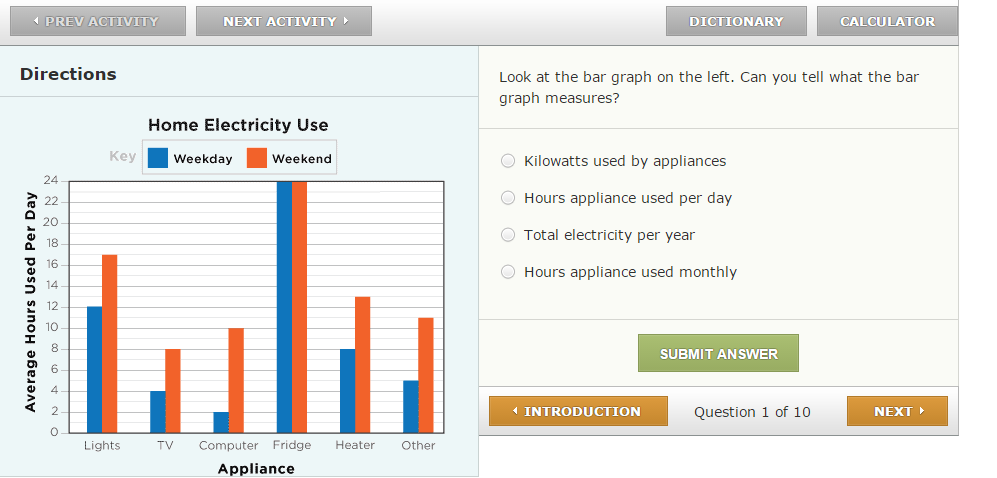
6. Interactive Math Activity | Reading Bar Graphs.
Click Image to Enlarge
Try out this second grade-level math lesson to practice reading bar graphs with your class SEE MORE
7. Interpret Line Plots.
Click Image to Enlarge
Interpret line plots to answer questions. SEE MORE
8. Interpreting Charts and Graphs.
Click Image to Enlarge
Three activities for students to practice finding information in a chart and/or graph. SEE MORE
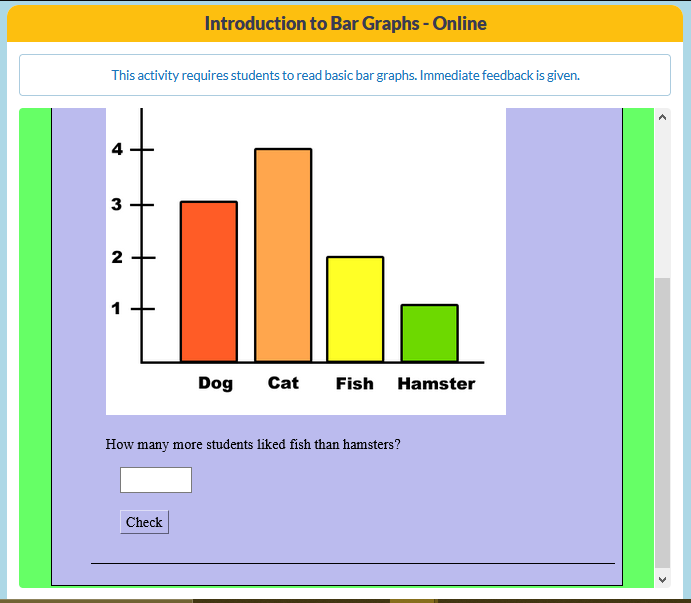
9. Introduction to Bar Graphs - Online.
Click Image to Enlarge
This activity requires students to read basic bar graphs. Immediate feedback is given. SEE MORE
10. Labelled Diagram Parts of a Picture Graph.
Click Image to Enlarge
Drag and drop the pins to their correct place on the image. SEE MORE
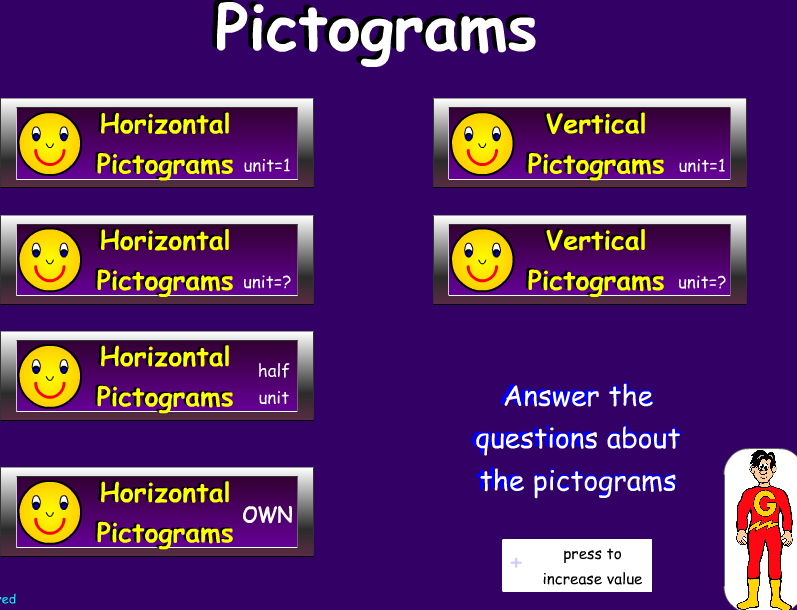
11. Pictographs.
Click Image to Enlarge
Select from a variety of pictograph activities and answer the questions. User can even choose own values. SEE MORE
12. Picture Graphs Quiz.
Click Image to Enlarge
A series of multiple choice questions. Tap the correct answer to proceed. SEE MORE
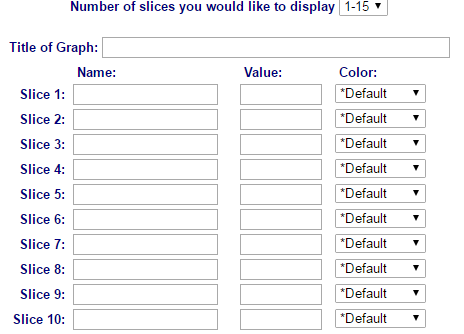
13. Pie Charts.
Click Image to Enlarge
Create your own pie chart. SEE MORE
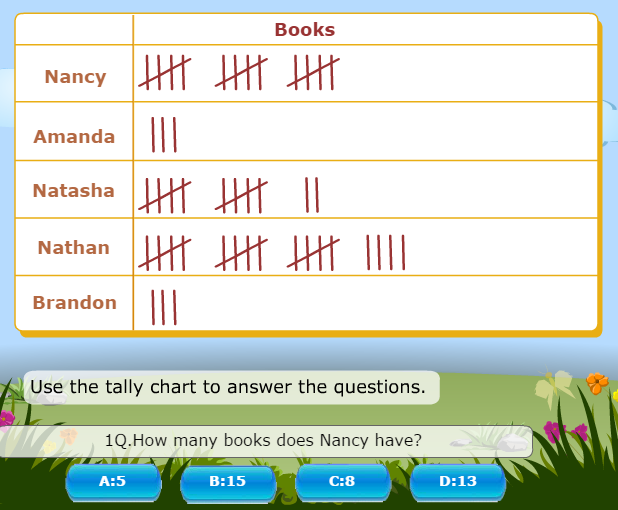
14. Tally Chart Quiz.
Click Image to Enlarge
Use the tally chart to answer each question. SEE MORE
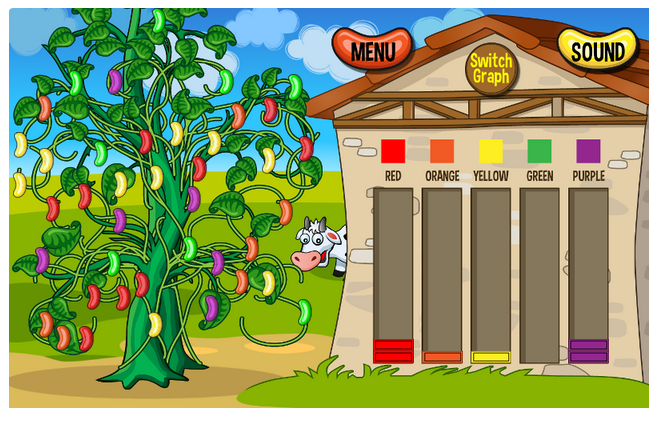
15. The Jellybean Tree.
Click Image to Enlarge
“Pick” the jellybeans and drag and drop them to their correct places in a bar graph shown on the other side of the screen. Each time the game is played there will be a different total number of jellybeans and a different number of each color of jellybean; always between 25 and 50 total. SEE MORE
16. Which Bar Graph Is Correct?
Click Image to Enlarge
Identify which bar graph corresponds to the information given. (Free but with ads) SEE MORE

Internet4classrooms is a collaborative effort by
Susan Brooks and Bill Byles.

advertisement
advertisement
Use of this Web site constitutes acceptance of our Terms of Service and Privacy Policy.